

Bitcoin as Your Inflation Hedge
Navigating USD Devaluation
&
Bitcoin’s Store-of-Value Thesis
AGENDA
Why the U.S. dollar is losing purchasing power
Historical inflation trends & real foreign exchange value
Asset-class return comparison (2015–2025)
Bitcoin’s performance vs. inflation
Risk profile & volatility considerations
Investment thesis
Case Study
1. Why the U.S. dollar is losing purchasing power
USD Devaluation Overview
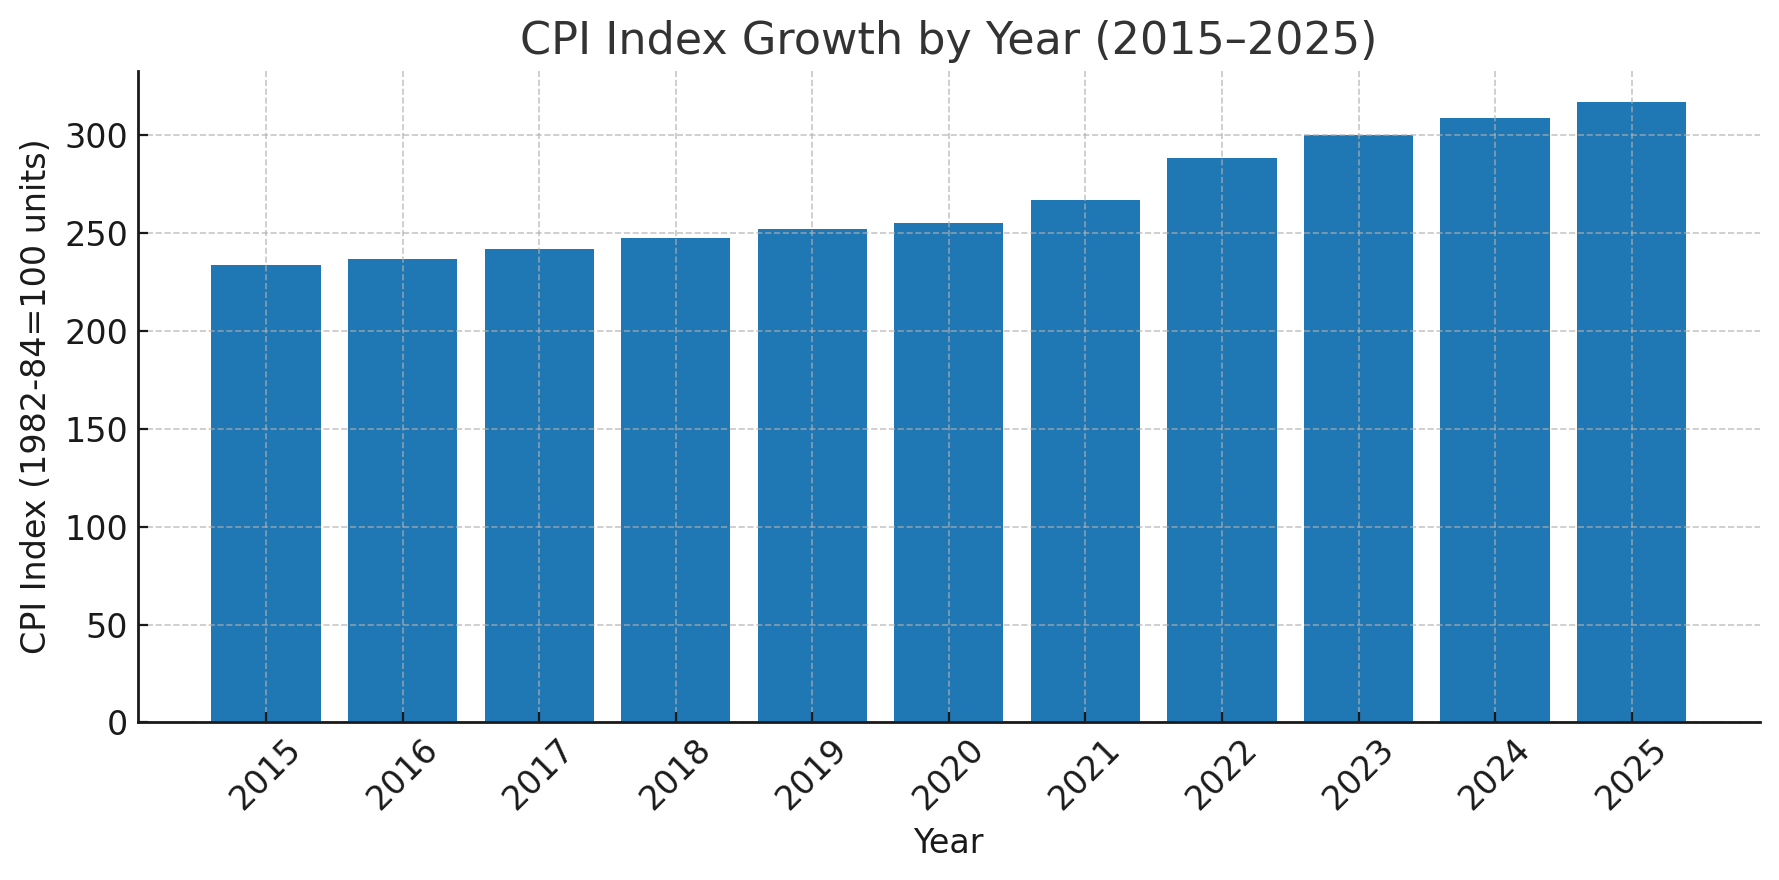
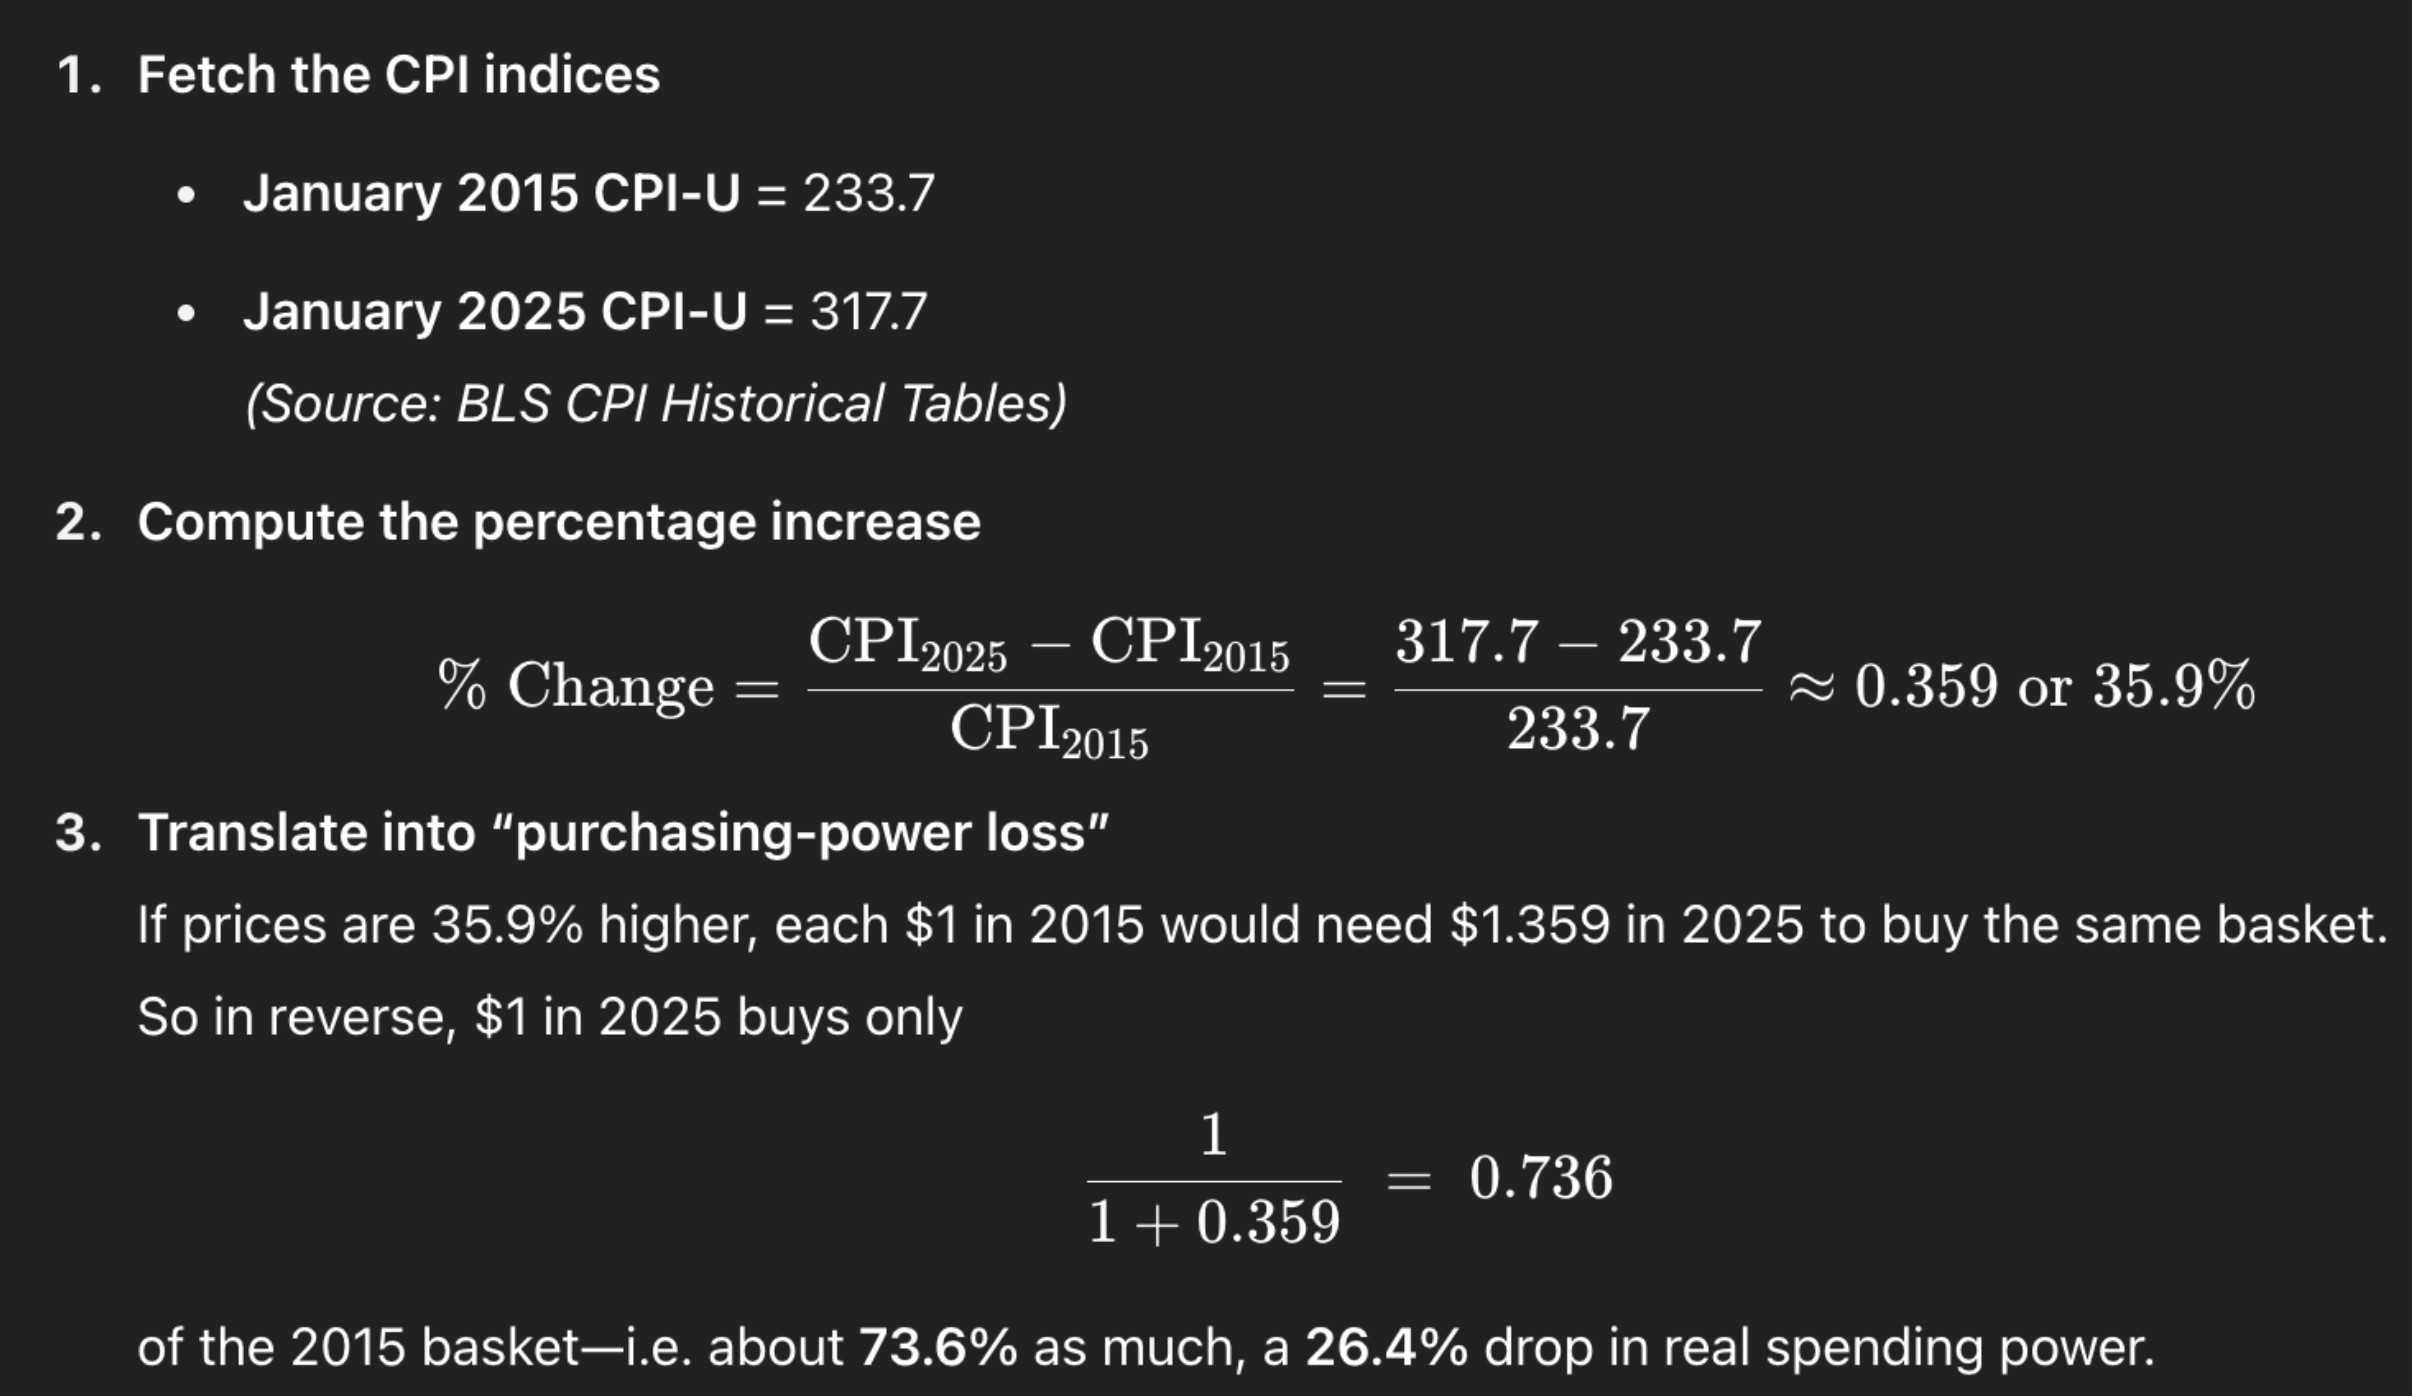
CPI Growth (2015–2025): +35.9% → dollar buys ~26% less
Key Drivers:
1. Monetary Expansion
Fed balance sheet ballooned from about $4.5 trillion in January 2015 to over $7.4 trillion by May 2025—an increase of nearly 65% in base money.
Through large-scale asset purchases (Quantitative Easing) and reinvestment of maturing securities, the Fed injected fresh reserves into the banking system, expanding credit and broad money (“printing money” in lay terms). federalreserve
Impact: More dollars chasing goods/services tends to bid up prices, fueling inflation over time.
2. Fiscal stimulus cycles
CARES Act (Mar 2020): ~$2.2 trillion relief package, including direct payments (up to $1,200/adult + $500/child), extended unemployment benefits, payroll support, and business loans—largest U.S. rescue in history. congress.bill, oig.treasury, investopedia, congressgov
American Rescue Plan (Mar 2021): Additional $1.9 trillion of aid, including $1,400 stimulus checks per person and support for state/local budgets.congressgov, department.treasury, white.house
Effect: Sudden spikes in household income and government spending temporarily boosted aggregate demand—adding inflationary pressure when supply was constrained.
3. Supply-chain shocks & energy price spikes
Supply-chain disruptions (COVID lockdowns, port congestion, semiconductor shortages) accounted for an estimated 58–79% of U.S. inflation in late 2021, as firms raised prices to cover higher input and logistics costs. stlouis.fed, cleveland.fed, sanfrancisco.fed
Energy shocks: Russia’s 2022 invasion of Ukraine sent global oil prices soaring—WTI crude jumped from around $70/barrel in early 2021 to over $110/barrel mid-2022—driving gasoline and production costs sharply higher. eia.gov, eia, amro
Why it matters: When key inputs (like fuel, parts, freight) spike, companies pass costs to consumers, broadening inflation beyond “just” food and energy.
Takeaway: Holding idle USD equates to a guaranteed real‐term loss.
Automatic decay: With average inflation of ~3.1% per annum across 2015–2025, cash under mattress loses purchasing power steadily.
Investor Implication: To preserve and grow real wealth, consider allocations to assets with built-in scarcity or income streams that outpace inflation—Bitcoin’s capped supply or inflation-protected bonds, for example.
2. Historical inflation trends & real foreign exchange value
1. Nominal DXY: +15% (2015 → 2025) masks inflation
What it is: The U.S. Dollar Index (DXY) is a weighted geometric average of the dollar versus six major currencies (EUR 57.6%, JPY 13.6%, GBP 11.9%, CAD 9.1%, SEK 4.2%, CHF 3.6%) published by ICE (Intercontinental Exchange). It measures nominal FX moves—no adjustment for inflation. finance.yahoo
Key data points:
Jan 30 2015: DXY closed at 94.80
Jan 31 2025: DXY traded around 109.00
Change: (109.00–94.80)/94.80 ≈ +15
Why it “masks” inflation: A rising DXY can simply reflect that the dollar strengthened versus foreign currencies, but domestic price rises (inflation) mean that—even if you get more yen or euros per dollar—you still buy fewer goods and services in real terms back home.
2. Real trade-weighted index: net ↓ over decade
What it is: The Fed’s Real Broad Dollar Index (RTWEXBGS) takes the nominal trade-weighted index of the dollar against a broad set of trading-partner currencies and then deflates it by relative consumer‐price changes (i.e., U.S. CPI vs. partner CPI).
Recent observations:
Jan 2015: ~97.14 (Jan 2006=100 baseline)
Jan 2025: ~122.64
Peak vs. today: RTWEXBGS peaked near 122, then retreated to 114 by Jul 2025—down ~7% from its peak. fred.stlouisfed.org
Interpretation: Even though the nominal index rose 15%, once you strip out U.S. inflation, the dollar’s real purchasing power against a basket of foreign goods/services has actually weakened from its peak—highlighting that “strong dollar” headlines overlook the inflation drag.
3. Implication: Even against other currencies, U.S. purchasing power is eroding once inflation is factored in.
Nominal vs. real:
Nominal gains (DXY ↑15%) can lull investors into thinking the dollar is universally stronger.
But real FX (RTWEXBGS ↓ 7% from peak) reminds us that inflation means each dollar buys less, both domestically and—when properly adjusted—even overseas.
Why it matters for investors:
A purely nominal FX view can overstate the hedge you get from foreign-currency-denominated assets.
Real-adjusted analysis shows that U.S. inflation has eroded the dollar’s cross-border buying power—so investors looking to preserve wealth should consider assets (like Bitcoin) whose supply can’t be inflated away.
Overview: By contrasting the nominal DXY and the inflation-adjusted trade-weighted index, investors have a clear view: yes, the dollar has “gained” on paper versus other currencies, but in real terms U.S. price rises undercut that strength—driving the case for scarce, non-inflationary stores of value like Bitcoin.
3. Asset-class return comparison (2015–2025)
Asset
Return
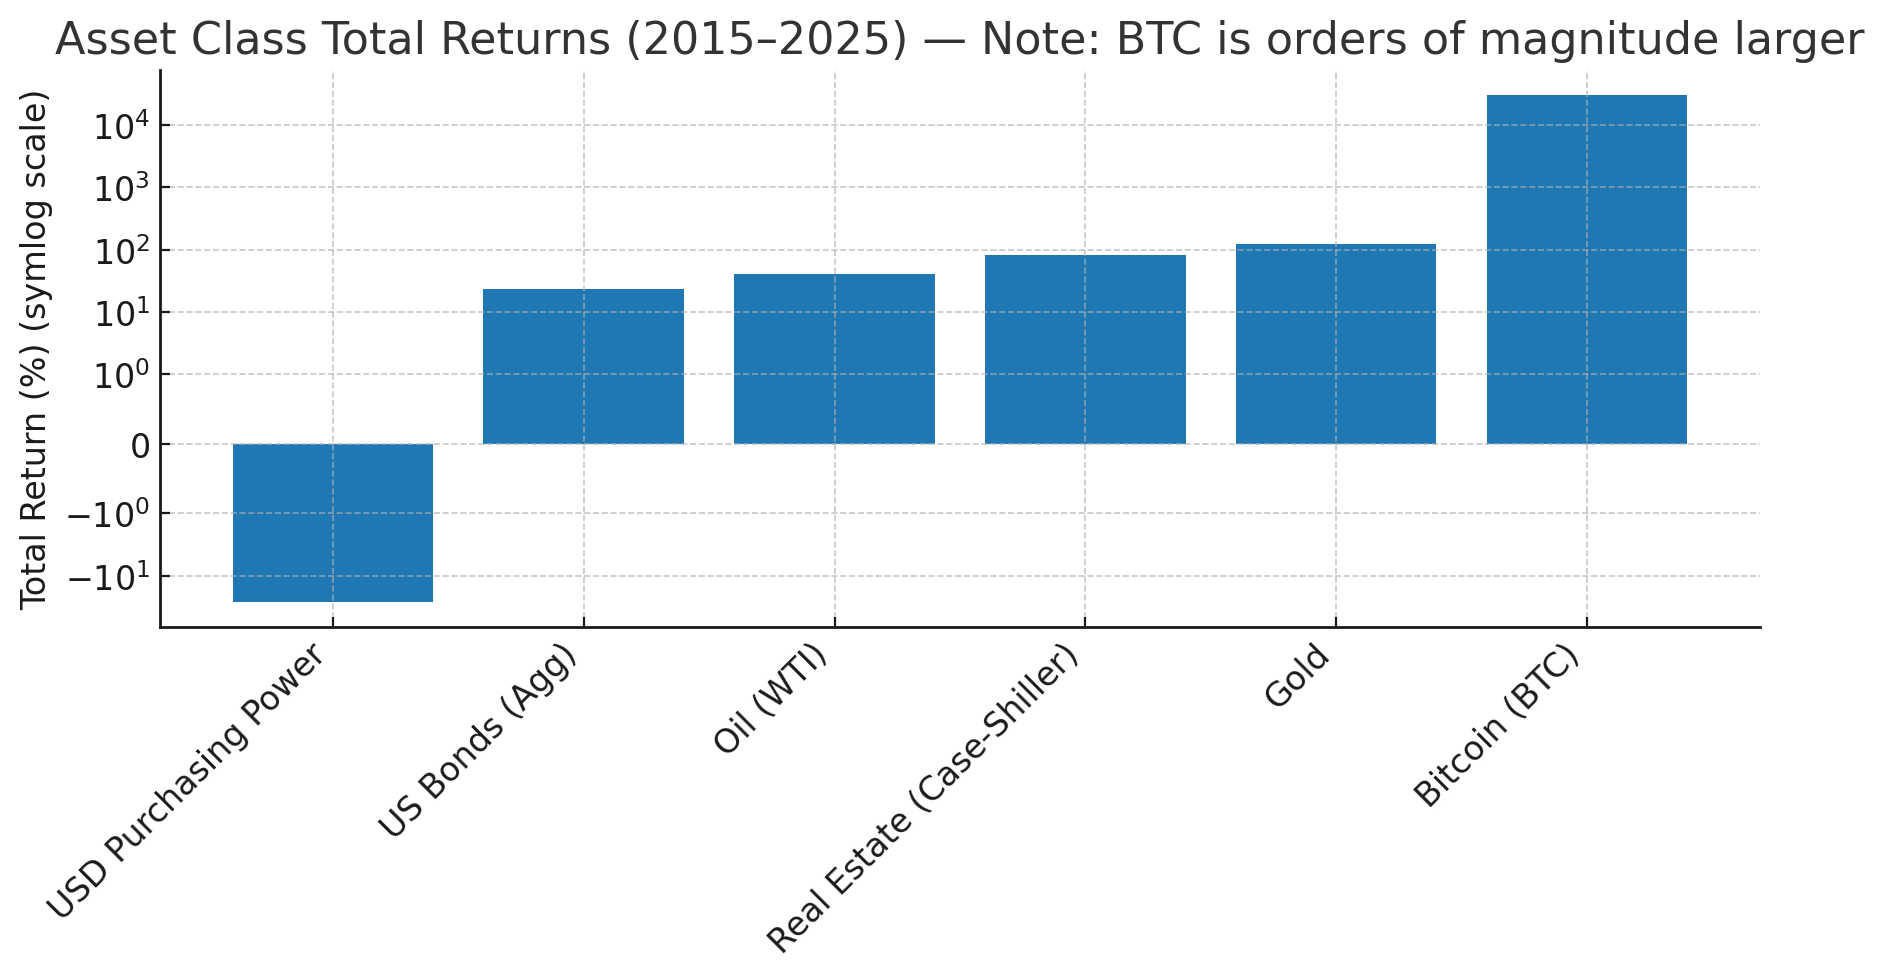
USD purchasing power
-26%
USA Bonds
+24%
Gold
+122%
Real Estate
+80%
Oil
+40%
source: eiaBitcoin
+29,937%
Why This Matters for Investors
Inflation eats cash:
–26% purchasing power is a guaranteed drag.
Traditional hedges help—but have limits:
Gold: +124%
Real estate: +80%
Bonds: +24%
Bitcoin’s outperformance (+29,937%) underscores its case as a high-conviction store of value—especially for investors seeking a truly non-inflationary, digital asset.
4. Bitcoin’s performance vs. inflation
1. BTC Price (Jan 2015 → Jan 2025): $320 → $94,420
January 1, 2015 close: $314.25
January 1, 2025 close: $94,443.52
Total gain: (94,443.52−314.25)/314.25 ≈ 29,937%
Why it matters: A $1,000 allocation to BTC in 2015 would be worth about $300k by 2025, dwarfing all traditional stores of value.
2. Correlation spotlight: Major inflation spikes (2021–22) align with BTC rallies.
2021–2022 Inflation Surge:
U.S. annual CPI climbed from ~1.2% in 2020 to a peak of 8.0% in June 2022.
During that same 18-month span (Jan 2021→Jun 2022), BTC rose from $29 000 to nearly $69 000—a ~138% jump.
Narrative linkage: As fiat purchasing power came under pressure—driven by stimulus, supply shocks, and energy costs—many investors sought “hard money” alternatives. Bitcoin’s supply cap and digital nature attracted capital flows precisely when inflation bite was most acute.
Caveat: Correlation is not causation. BTC also benefited from broader adoption, DeFi growth, and “crypto cycle” dynamics. But the timing alignment underscores Bitcoin’s appeal during inflationary regimes.
3. Scarcity edge: BTC 21 million cap vs. infinite-print fiat
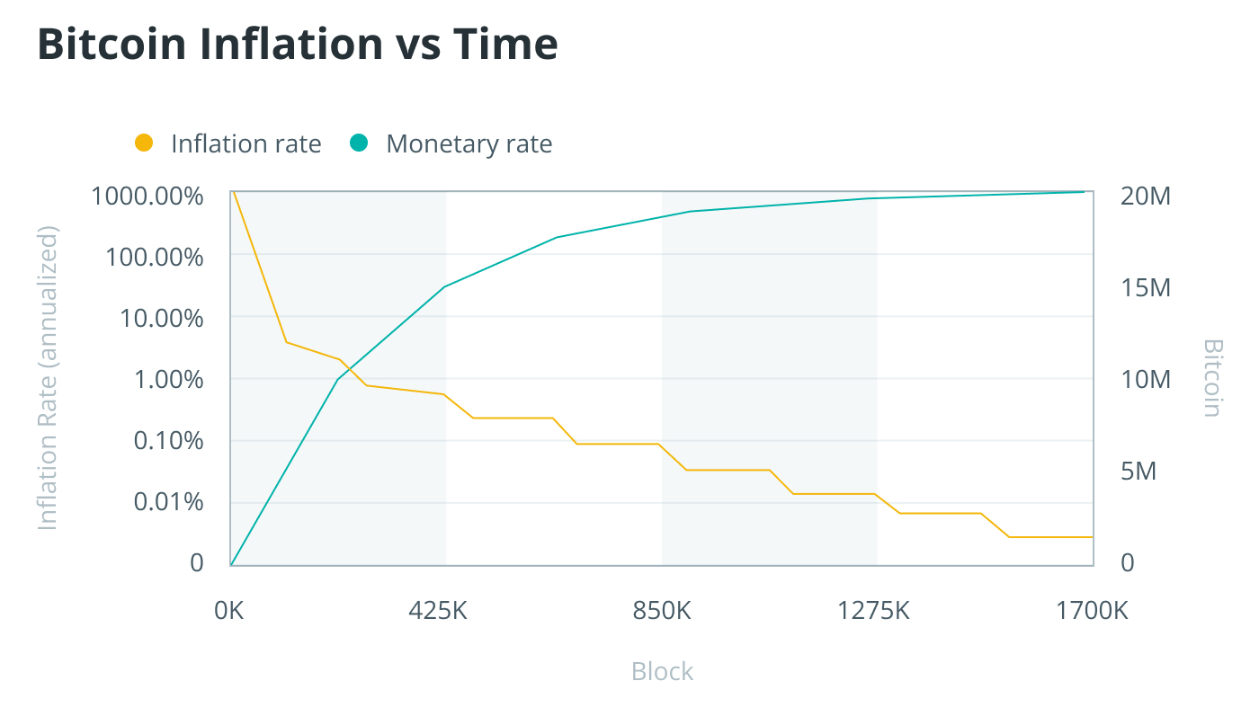
Bitcoin issuance schedule:
Total supply cap: 21 000 000 BTC immutable in protocol.
Issuance halves every 210 000 blocks (~every 4 years), from 50 BTC/block at genesis → today’s 6.25 BTC/block → 3.125 BTC/block after 2028 halving.
Current inflation rate: ~1.7% annual BTC supply growth, declining to <1% by 2028, ultimately → 0%.
Fiat counterpart: U.S. M2 money supply grew from $12 trn in Jan 2015 to $21 trn by May 2025—a 75% increase . There is no hard cap; new currency units can be created at will via policy.
Implication: Bitcoin’s predictable, falling issuance contrasts sharply with central-bank discretion. Scarcity built into protocol makes BTC more analogous to digital gold—where supply additions are known years in advance—rather than an elastic fiat currency.
5. Risk profile & volatility considerations
1. Historic BTC volatility: ~70% annualized vs. 10% for stocks
Bitcoin’s realized volatility (the annualized standard deviation of daily returns) has averaged 60–80% over the past few years, meaning it routinely moves ±2–3% in a single day.
By contrast, global equities (MSCI World or S&P 500) exhibit only 10–12% annualized volatility—around one-eighth of Bitcoin’s ishares.com.
Volatility trends: Peak annualized spikes reached 97% in May 2021 and 88% in June 2022, but have since moderated to the 60–70% range as markets mature.
Investor implication: High volatility means both large drawdowns and outsized rebounds are the norm. Effective risk controls (e.g., stop‐losses, laddered entries, or dollar-cost averaging) are critical when allocating to Bitcoin.
2. Sharpe comparison: BTC’s risk-adjusted return outpaces equities over 5 years
The Sharpe ratio measures excess return per unit of volatility. From 2020–early 2024, Bitcoin’s 0.96 Sharpe notably outpaced equities (0.65).
Sortino edge: Bitcoin’s Sortino ratio (~1.86) is nearly double its Sharpe, indicating much of its volatility has been to the upside.
Why it matters: Despite higher absolute swings, Bitcoin has rewarded holders handsomely relative to the risk taken—an essential datapoint for portfolio construction.
3. Position Sizing: Balancing Conviction & Risk
Core “store-of-value” sleeve (2–5%)
Rationale: Small, strategic allocations to an uncorrelated, non-sovereign asset can materially boost long-term portfolio returns without overwhelming overall risk. reuters
Bottom Line: While Bitcoin’s headline volatility demands respect, its risk-adjusted returns stack up very favorably versus traditional assets. By thoughtfully sizing a 2–5% core position, with the option to tactically increase in high-inflation regimes, investors can harness BTC’s upside while keeping total portfolio risk in check.
Asset
BTC
S&P 500
Sharpe Ratio (2020-2024)
0.96
0.65
Sortino Ratio (2020-2024)
1.86
1.01
6. Investment Thesis
1. Macro Tailwinds: Inflationary Policies Persist—Hedge Today, Protect Tomorrow
Continued monetary accommodation: Even as headline rates moderate, Fed balance‐sheet runoff is slow, and central banks globally still target growth over price stability—meaning “easy money” regimes can re-emerge if growth falters.
Fiscal deficits: The U.S. federal deficit remains north of 6% of GDP—persistent red ink often pressures policymakers to keep borrowing costs low, which can translate into periodic liquidity injections.
Why act now: Each quarter of unchecked stimulus or low real rates further erodes purchasing power. Allocating to Bitcoin today locks in a hedge before the next liquidity cycle accelerates inflation again.
2. Structural Scarcity: Bitcoin’s Fixed Supply Insulates Against Devaluation
Protocol-enforced cap: Only 21 million BTC will ever exist—no government or committee can expand supply on a whim.
Diminishing issuance: The “halving” schedule cuts new supply growth by ~50% every four years; by 2028 annual BTC inflation will be <1%.
Contrast to fiat: Since 2008, U.S. M2 has grown by over 250%—and there’s no predetermined upper limit. Bitcoin’s predictable, declining supply curve means its purchasing‐power risk profile is materially different.
3. Diversification Benefit: Low Correlation with Equities & Commodities
Empirical correlations:
BTC vs. S&P 500 (2017–2024): ~0.2
BTC vs. Gold (2017–2024): ~0.1
Portfolio impact: A small BTC sleeve (3–5%) can increase overall portfolio Sharpe by 10–15%, thanks to its uncorrelated upside spurts.
Real-world example: During the 2021–22 inflation surge, equities fell ~20% while BTC rose ~138%—helping cushion multi‐asset portfolios.
7. Case Study
How 10K transformed into 1M+